🚧
SECTION ON RECONSTRUCTION
Work on this section is in progress. Everything will be available soon.
A manager spends all day betting on the future and calling it planning. Some people read that future off gut feel, some off horoscopes, some off tarot if it’s been that kind of quarter. We brought math: your own numbers, run forward, with the uncertainty left in the picture instead of quietly airbrushed out.
🚧
SECTION ON RECONSTRUCTION
Work on this section is in progress. Everything will be available soon.
Most business forecasts come in two flavours. There’s the single confident number in the board deck, the one everybody quotes and nobody believes, and there’s the forty-tab spreadsheet that one heroic person maintains and that goes on annual leave with them in August.
Forecast is the third option: the number, the spread around it, and a straight answer to the question nobody thinks to ask the spreadsheet, which is how often the thing has actually been right.
There’s an older problem underneath, though, and it has nothing to do with spreadsheets. Somewhere along the way the forecast and the plan quietly became the same number, and almost nobody noticed, because they are written in the same font and live on the same slide. They are not the same thing. The plan is what leadership has decided should happen. The forecast is what the business is actually going to do, and these two have a way of drifting a surprisingly long way apart while everyone insists they are holding hands.
The gap is not academic, it just bills you later. If there are no leads in the pipeline there will be no sales, no matter how confident the target sounds when it’s read aloud. If there are no orders, no materials and no people, production comes in light, whatever heroic figure is printed on the side of the machine. The plan describes where you’d like to end up. The forecast tells you whether you’re currently on a road that goes there.
A shareholder asks the manager how much money next quarter will bring. The manager says €2.7M. Not because he is lying, but because he is a person: last quarter came in around €2.5M, a slightly larger number feels like progress, and he would quite like the people in the room to think well of him. Which of us would do otherwise? The figure goes into the minutes, the meeting breaks up, and everyone wanders back to their actual job, reassured.
Then the quarter actually happens. Two leads drop out of the pipeline. The biggest customer asks to pay in instalments. The lead engineer goes on parental leave at a moment nobody finds convenient. And still, on every desk, sits the same serene €2.7M. When the books close light, the number is not the one that gets blamed. The manager is, for a failure of foresight he was never equipped to have, and shareholders tend to take this kind of thing personally.
If you recognised yourself anywhere in that manager, here is the good news: the people who forecast for a living, the ones with real money riding on being right, sorted this out long ago. They stopped promising a number and started promising a range, with scenarios attached. The weather service gives you a percent chance of rain, not a verdict on the sky. The Bank of England forecasts inflation as a band, not a digit. Engineers plan against a pessimistic, an expected and an optimistic case, and budget for all three. None of it is exotic. It is simply what forecasting looks like once the stakes are real.
And it quietly rewrites your job. Instead of spending the quarter hurling everything you have at the delivery of a sacred €2.7M, you spend it spotting the bad scenarios early and defusing them one at a time. Under that light your report is heroic either way: either the downside never showed up, or it did and you are the person who saw it coming and bought the company time to react.
So here is the closest thing to a magic pill this page will offer. Stop handing your shareholders a number and hand them a word instead: percentile. It’s the piece of jargon the genuinely clever money has leaned on for decades, and it travels under two labels, P50 and P10–P90, which sound like droids and mean something refreshingly simple.
P50 is the middle: the figure you beat half the time and miss half the time, the honest version of the single number you were going to quote anyway. P10 and P90 are the edges of plausible. The real result lands between them about eight quarters in ten, and wanders outside only when the quarter is genuinely cursed or genuinely blessed. The gap between them is the band, and this is the part worth tattooing somewhere: the width is the message. A skinny band means the future is basically pinned down, go sign the lease. A fat one means the future has opinions, so keep some powder dry. The band isn’t us hedging. The band is the information.
And it’s an honest band, because it isn’t something we drew by feel. It’s the model’s own track record of being wrong, stretched wider the further out you ask it to see. Next month is tight, because next month is mostly already sitting in your inbox as signed contracts. December is loose on purpose, because the alternative is a tight, confident December that you cheerfully plan payroll against and then spend the actual December explaining.
And steal one last trick from the professionals: regression to the mean. However badly everyone in the room wants the chart to go Up Only, an exceptional quarter is usually followed by an ordinary one, because reality keeps tugging the extremes back toward the average. That isn’t pessimism, it’s gravity, and we bake it in as one of the scenarios, so the model quietly refuses to believe your best month will simply repeat itself forever.
Here’s the thing about profit: it is not one simple number, however much we treat it like one. It is the single figure everyone in the room actually came to see, the reason the meeting exists at all, which is precisely why nobody likes to dwell on how many moving parts feed it. Dozens of things nudge it up and drag it down every month, and a humbling number of them are not yours to command: a client’s payment habits, a supplier’s prices, an exchange rate, a flu season, a competitor having a good idea on a Tuesday.
Which is why forecasting profit as a single blob is a category error. That headline number is a committee. The contract that renews unless the client dies sits right next to the deal that exists mostly in a salesperson’s imagination, and averaging the two gives you a figure that is confidently wrong about both. So we don’t. Forecast pulls each metric apart into the pieces that genuinely behave differently, projects each on its own terms, and adds them back up. The band you just met is built from the bottom out of those pieces, which is why it widens and narrows for honest reasons instead of being a flat plus-or-minus somebody picked because it looked prudent.
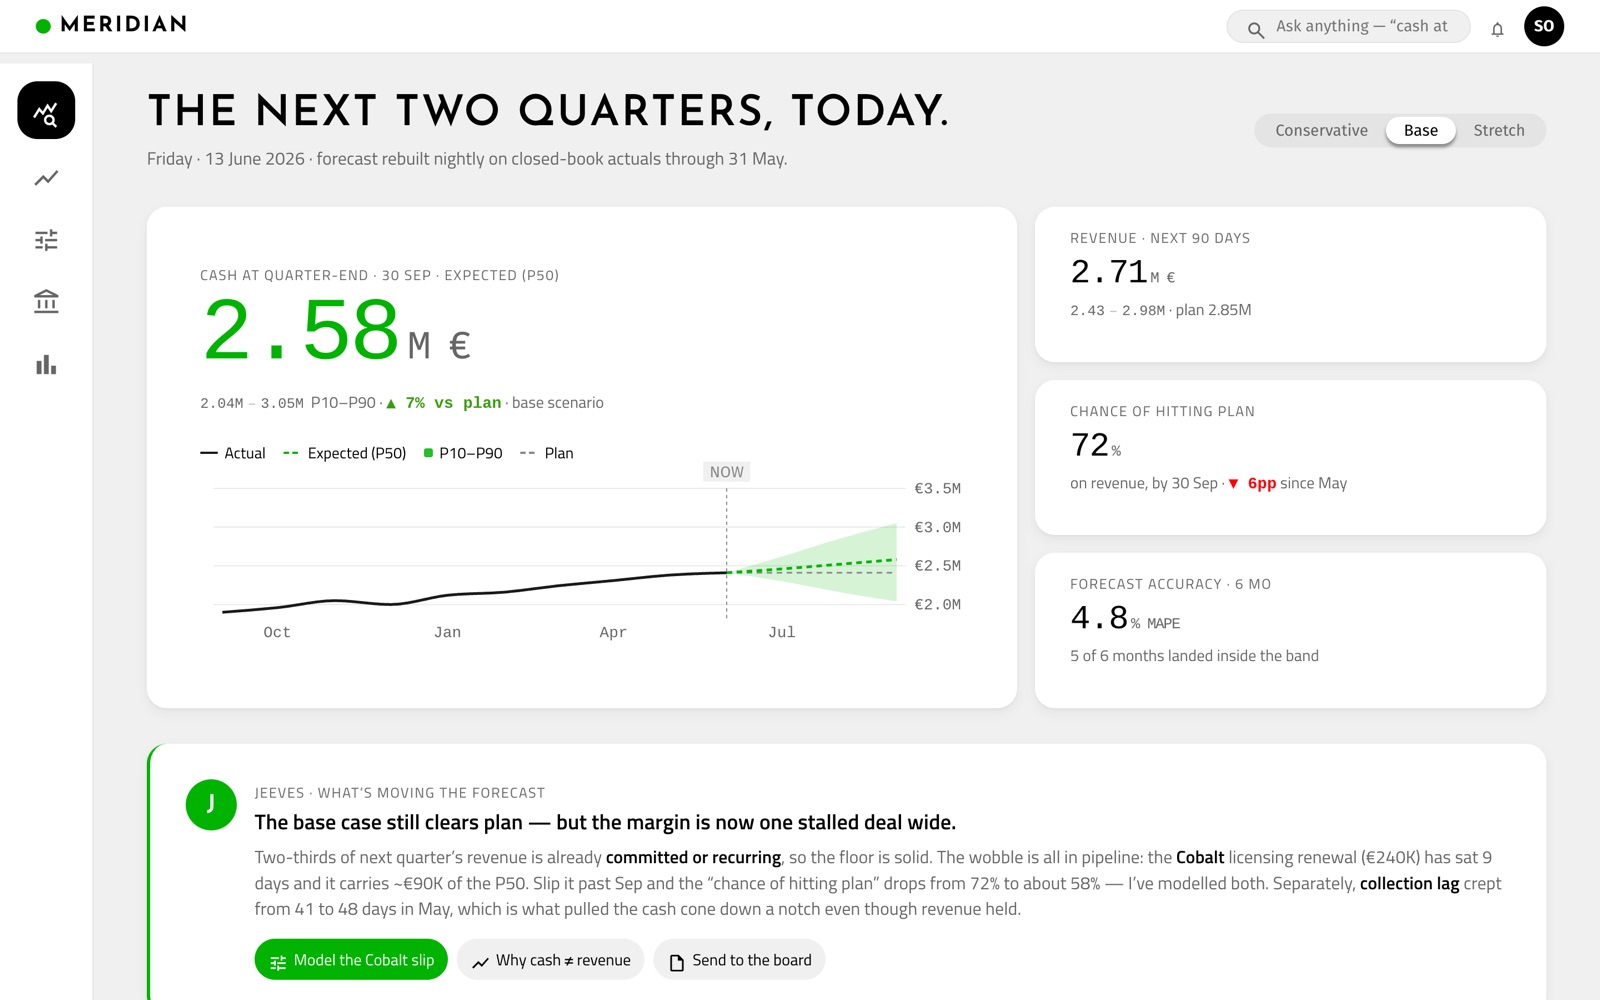
Quarter-end cash as an expected figure with its cone, the probability of hitting plan, and the part most tools quietly omit: the model's own accuracy over the last six months. The number and its credibility, on one screen.
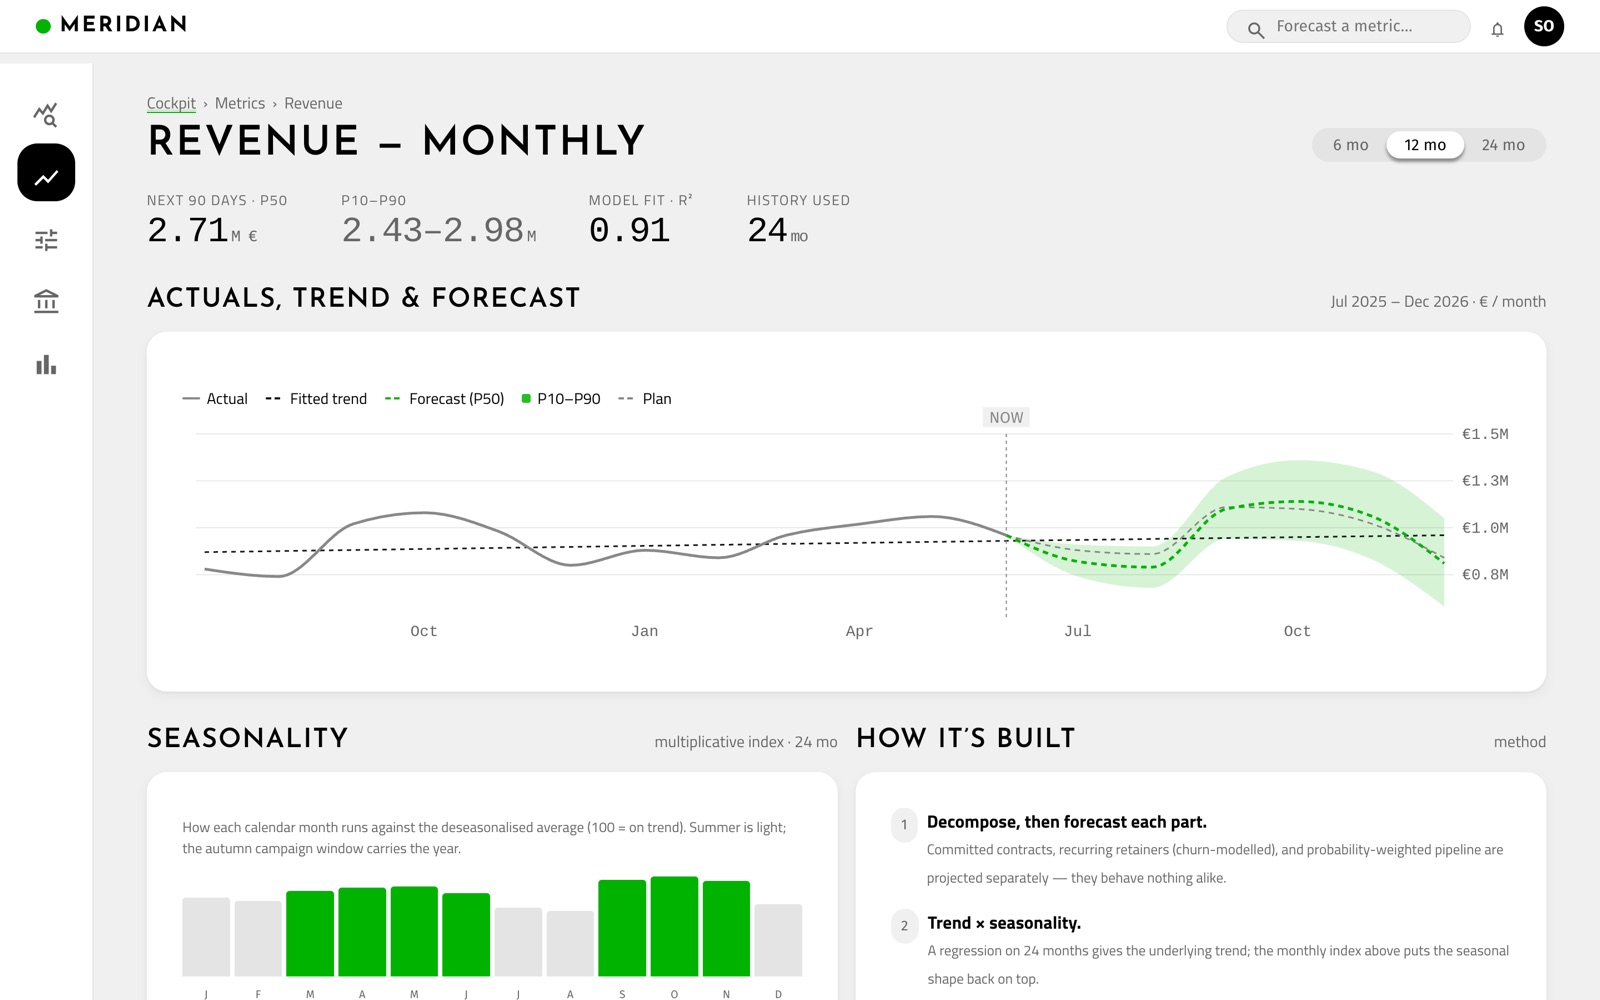
Twenty-four months of actuals, a fitted regression trend, and the forecast cone in front of it, plus the seasonal index that explains why August is always the quiet month. Drill into any metric and see exactly what the projection is standing on, month by month.
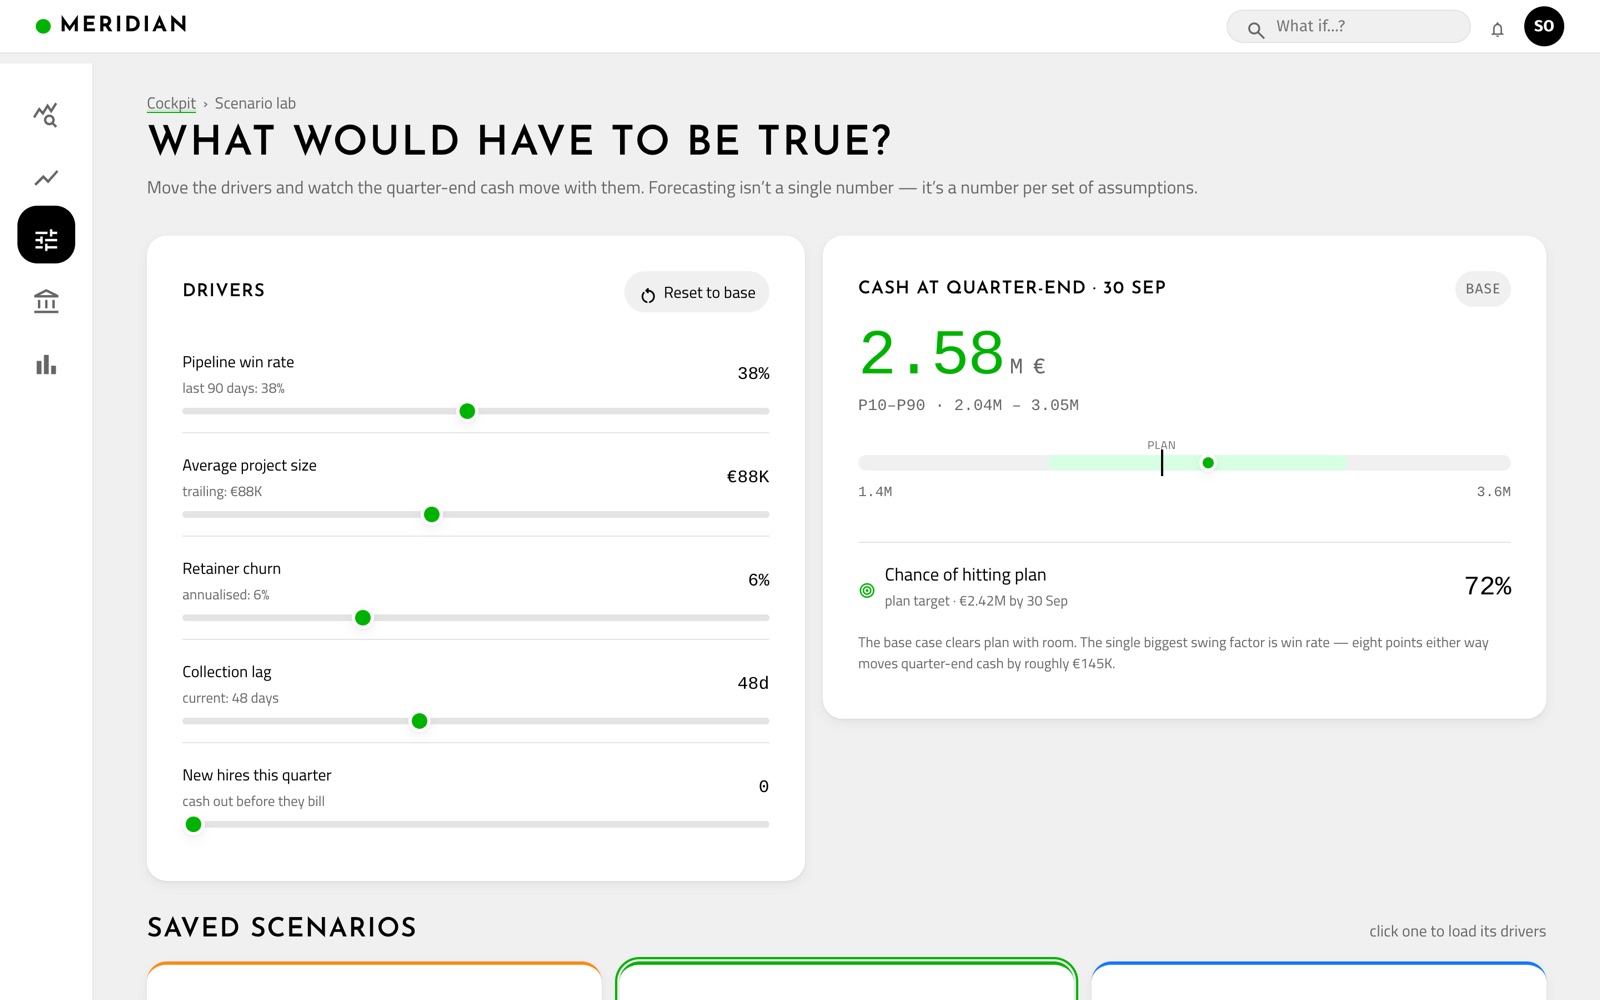
Win rate, average deal size, churn, collection lag, hiring: the handful of levers the number actually stands on. Drag one and quarter-end cash moves live. Save the three cases your board argues about. Then check the backtest to see how the model has actually performed.
The split matters because the pieces carry wildly different certainty. Signed contracts and modelled retainer renewals are the floor: they move only if a client actively fires you. Probability-weighted pipeline is the part doing all the trembling, and it’s where the band gets fat. Keeping them apart is the difference between “we’ll probably be fine” and “€1.7M is locked, and the rest of the quarter is one stalled deal away from a very different Monday.”
There’s no black box here, because operators don’t trust black boxes and they are correct not to. You can have the whole method in a paragraph.
Each piece gets its own forecast. The trend is a regression fit on two years or more of your own actuals, with a seasonal index laid back on top so that August is allowed to be August. The bands are the model’s own track record of error, carried forward and stretched with the horizon. That’s the lot. It’s plain arithmetic you could in principle check by hand, and it learned the future from your company, not from some borrowed model that once met a different business and quietly assumes you’ll behave the same way.
And it never sits still. The model rebuilds itself every day on whatever your systems fed it overnight, so the forecast is a living thing rather than a quarterly ceremony. A big lead lands in the pipeline and the band lifts at the top. A delay creeps into production and the projection visibly sags. You don’t wait for the month-end deck to discover the future has moved; you watch it move.
That’s the fast loop. Underneath it runs a slower and more important one. Once a month, when the books close, the forecast you made last month gets graded against what actually happened: how far off, in which direction, how often reality landed inside the band. That grade feeds straight into the next set of bands, so the model is quietly scoring itself against reality and getting less wrong over time. And the spots where it keeps missing aren’t an embarrassment to bury. They’re the bottlenecks, the parts of the business that refuse to behave, and the model points at them by name.
Together the two loops are what make the alerts a favour rather than a nuisance. Hang your plan on the forecast and it will tell you the moment the two begin to diverge, well before the gap is big enough to need a meeting. The same goes for sudden lurches in the forecast itself: a marquee deal slips, the projection drops a storey overnight, and the alert reaches you while there is still time to do something other than apologise. The dashboard interrupts you only when the interruption is worth having.
Forecasts have a timing problem in most companies, which is that they become interesting at exactly the moment they stop being useful. The plan gets missed, somebody asks why, and now the whole conversation is an autopsy. Everyone is suddenly very insightful about a quarter that is already over.
The point of a forecast is to drag that conversation earlier, back to when you could still change the ending. So when a shareholder starts in on the missed number, you slide the forecast across the table. It flagged the gap while there was still a quarter left to close it, and it named the decisions quietly making the target impossible: the hire that never happened, the pipeline that was always a little too thin, the collection lag nobody got around to. The meeting stops being about whose fault the past was and turns into which lever to pull next, which is the only version of that meeting worth having.
There is a quieter dividend, too. For the first time the manager knows exactly what this week’s job actually is. When the floor is under threat you defend the bottom of the range and you hold the line. When there is daylight above, you push the top of the band higher and you go on the attack. There is a medal for each, one for defence and one for valour, and neither keeps you waiting long once you can show which battle you were actually fighting.
We built a working demo on synthetic data. No login, no sales call, nobody emailing you afterwards. Click between the cockpit, a metric deep-dive and the scenario lab, and drag the sliders until something breaks.
These are the numbers your systems already hold. We just ran them forward, left the uncertainty where you can see it, and showed the working out, so the figure in the next board deck is one you can actually defend when someone asks, as someone always does, where it came from.
Want to see what your business is actually doing?
Book a demo today. Schedule your reality check.
Sales 24/7 Hotline:
Phone/WA: +971 52 87-86-777
hi@raredigits.io